

This post and analysis was done by @stringbootbill - he is active on twitter and regularly posts independent analyses of the Dinger Stats model performance.
In a recent Twitter thread, I examined the actual performance of a few MLB teams against Dinger Stats’ simulated win probabilities. We saw how teams like the New York Yankees and the San Diego Padres have consistently won both as favorites and underdogs, while a team like the Milwaukee Brewers have, on average, won and lost in line with the model’s predictions. Not only that, but the Brewers have won by increasingly wider margins as the model has listed them at higher win probabilities. A slight problem in evaluating these teams, however, is that they seldom are predicted losers. This gives us a little trouble in evaluating their performance as underdogs because the sample sizes are quite low. Here, I think it would be worthwhile to examine a team the model takes a more balanced approach towards.
The St. Louis Cardinals, unlike the Brewers, Dodgers, Mets, Padres, and Yankees, have roughly split their 65 games played as both a favorite and an underdog according to the model. The Cardinals have appeared as a favorite 53.85% of the time and as an underdog 46.15% of the time. Of their 35 games as a simulated favorite, the Cardinals’ average “favorability” (that is, the average of all simulated win probabilities as a favorite) is 57.84%, while the average of all their simulated win probabilities when listed as an underdog is 42.07%. We would hope, then, that in aggregate the Cardinals would win at least 58% of the time when the model predicts them to win and win at most 42% of the time when the model predicts them to lose. In comparing these figures to actual performance, the Cardinals are 23-12 (65.71% win percentage) as a simulated favorite and 14-16 (46.67%) as a simulated underdog. They are also 9-5 (64.29%) as a road favorite and 14-7 (66.67%) as a home favorite.

Here, we see that the model appears to be getting things right with the Cards, and we have sample sizes of 30 or more for both categories. They are winning at a higher clip than their average expected win probability as a simulated favorite would suggest, and while they are winning slightly more than we would hope as a simulated underdog (46.67%), they are still under .500 when the model predicts a loss. Knowing that the Cardinals appear to be performing in general accordance with the model’s predictions, we can crunch these numbers a little bit more and look for possible edges.
First, let’s simply look at how the Cardinals’ real win percentage agrees with increasing simulated win probabilities:
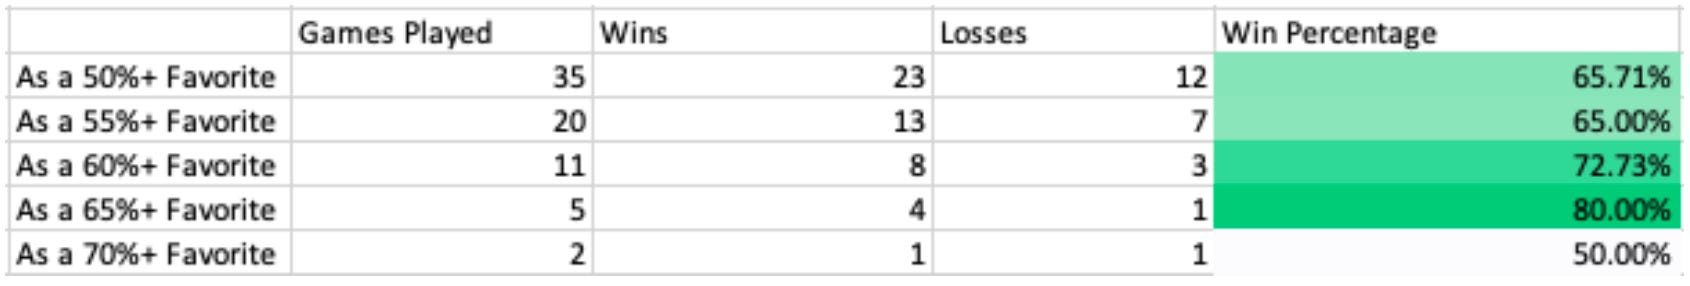
The Cardinals have played 35 games as a 50% favorite or higher, 20 as a 55% favorite or higher, 11 as a 60% favorite or higher, and seven as a 65% favorite or higher. Games as a 50%+ favorite is the most informative category because it is where the largest sample of games is, but it is still encouraging to see that win percentages above 55% and 60% predicted win probabilities appear to be strong. The 65%+ and 70%+ simulated win probabilities are hard to glean any useful information from because sample sizes are so low, but the 65%+ category seems to at least be on the right trajectory.
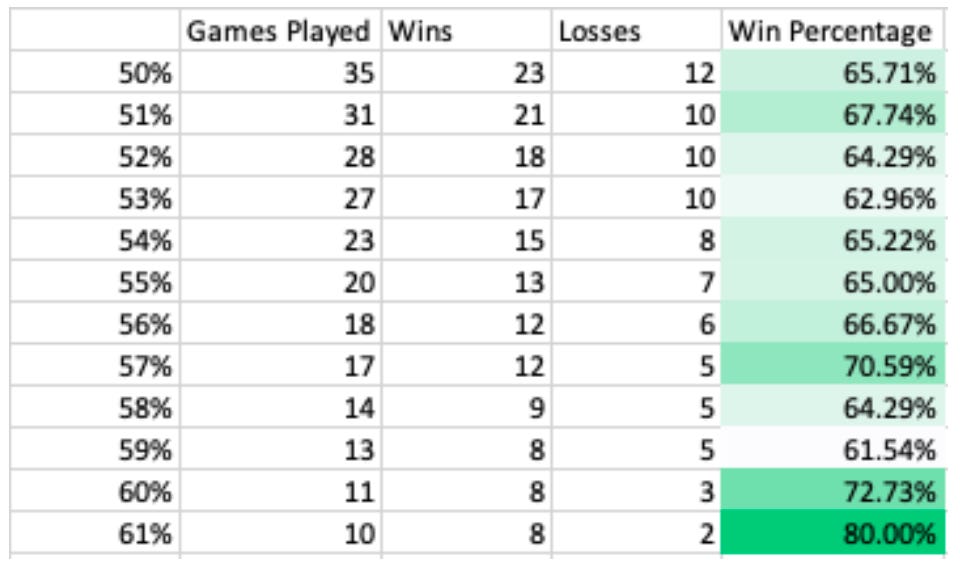
We can also look at the Cardinals’ win percentages in one percent increments. On the right is a table that shows how the Cardinals perform when listed at or above increasing win probabilities where the team has played a sample of at least ten games. As a 57%+ favorite, for example, the Cardinals are 12-5 (70.59%). Again, it is hard to make any definitive conclusions about some of this data because sample sizes get smaller as win predictions get higher, but the Cardinals do appear to win more often (particularly when simulated above 57%, 60%, and 61%) when the model provides them a higher win probability. Most important, though, is that all of these win percentages are well above 60%. More analysis is needed as we get more data, but roughly speaking, the model appears to be tracking the Cardinals’ successes well.
In 30 games as a simulated underdog, the Cardinals are 14-16. Moving down in five percent increments, we see that the Cardinals appear to be losing at higher rates when the model provides them with lower win probabilities. They are 4-12 (25%) when given below a 45% win probability, 3-7 (30%) when given below a 40% win probability, and 2-4 (33.33%) when given below a 35% probability. Again, we get smaller sample sizes with lower simulated win probabilities, and it is important to note that 14 of the Cardinals’ 30 games as underdogs have been played in that 45-49.99% win probability window.

We can look at these figures further in decreasing one percent increments as well. Here, we see that the Cardinals’ actual win percentage drops as the model gives them lower win probabilities, although their actual win percentage begins to bump back up when given a 38% or lower probability to win. One important thing to note is that the Cardinals are 4-1 in that 49-49.99% win probability slot, but when we move below 49% favorability, we see the Cards’ actual win percentage begin to drop significantly. Of the 14 games the Cardinals have won as an underdog, four of those wins have occurred when the Cardinals were a simulated underdog in the 49-49.99% slot.

Lastly, let’s briefly look at some -1.5 run line figures for the Cardinals as a simulated favorite:
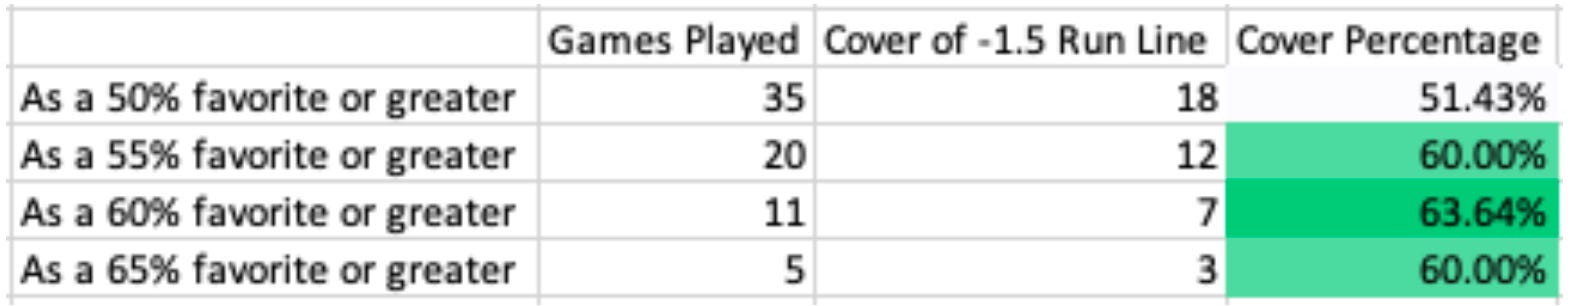
The Cardinals have won by two or more runs 18 times in 35 games (51.43%) as a 50%+ favorite, 12 times in 20 games (60%) as a 55%+ favorite, seven times in 11 games (63.64%) as a 60%+ favorite, and three times in five games (60%) as a 65%+ favorite. As expected, these figures are slightly lower than the Cardinals’ real win percentages as simulate favorited, but it is a positive sign that the team appears to be winning by wider margins as the model favors them more.
At this point in the season, the Cardinals serve as a great example of how one can use the model to generate a return. For one, the Cardinals are a good team that, unlike the Yankees and Dodgers, have more balanced lines available at sportsbooks. It may be anecdotal, but in my experience, you are far more likely to find juiced lines on the Dodgers and Yankees than you are on the St. Louis Cardinals. Furthermore, the team’s actual performance has generally tracked well with the model’s predictions, which makes them an ideal candidate for further analysis. When the model suggests they will win, they tend to win, and when it suggests they will lose, they tend to lose. The Cardinals also seem to win at higher clips when the model lends them higher expected win probabilities, and they seem to lose more often as the model assigns them lower win probabilities. This is a promising sign, although it is important to note that we are dealing with increasingly smaller sample sizes the more we move from a 50% expected win probability. Knowing that the model tracks the Cardinals’ performance well and that sportsbooks seem to take a more honest approach towards the team, there are plenty of edges to be found in comparing Dinger Stats’ predictions with those of the sportsbooks. If Dinger lists the Cardinals as a 60% favorite or greater when the implied odds from a sportsbook give them a much lower win probability, a bet on the Cardinals to win, or even cover a run line, will generally be a value bet. Similarly, if the books think the Cardinals will win while Dinger does not, a bet on their opponent would be a good one. If the Cardinals continue to perform in accordance with the expectations of the model, there could be a great deal of money to be made over the next few months of the season.