

Mid-Season Analysis

The Data
110 Club picks and all Dinger Stats predictions are available for download in .csv format here:
https://www.dingerstats.com/2022performance
Please verify these numbers for yourself and write to mail@dingerstats.com or find us on Twitter @DingerStats if you have questions or comments.
Intro
This is an analysis of model performance using theoretical profit/loss as a performance metric only. Nothing stated here should be taken as advice on how to place your bets.
The Dinger Stats daily sheets are a research tool only and any bets you make are at your own risk.
The odds used to calculate profit/loss in all tables are from online offshore sportsbooks that have no affiliation with Dinger Stats. The odds are not “sharp” and are taken approximately one hour prior to game start.
All profits/losses are calculated by risking a unit on underdogs and risking to win a unit on favorites.
For example:
A line is +120 the model risks 1u to win 1.2u (underdog )
A line is -120 the model risks 1.2u to win 1u (favorite)
Mid-Season Performance
Summary
Blindly tailing the model will yield the most profit if only teams predicted to win at 60% confidence or greater are taken. This yields a record of 281-177 for +36.54u.
Accuracy across all combinations of home/away + favorite/underdog is relatively high, but vigorish is the main obstacle to profits.
The Dinger Stats model appears to have a slight edge on the sportsbook vigorish when predictions fall between 55% and 65% confidence. The most profitable spots yield around 0.05u per bet placed.
Naive Moneyline Predictions
For our purposes “naive” means ignoring home/away & underdog/favorite, a.k.a. blindly tailing.
These values are cumulative, e.g. the Moneyline Confidence Cutoff (ML CC) of 60% includes all wins + profit + loss in the 65% and 70% categories.

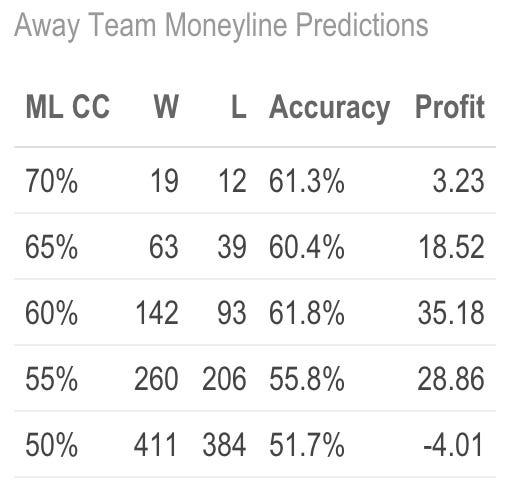
Away Teams Only
When we look at the model’s performance on away teams only it becomes more profitable, especially below 60%.
Home Teams Only
When we compare this to home team winning predictions it becomes apparent that the model is much better at predicting road team winners than home team winners.

For context, away teams have won 729 games so far this season and home teams have won 802 games. In other words, away teams have won 47.6% of the time so far in 2022.
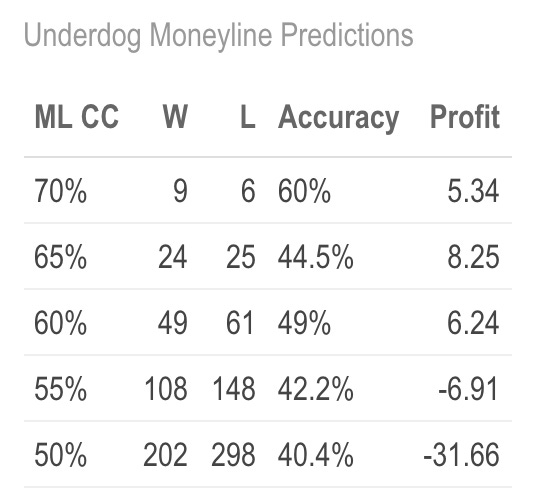
Underdogs vs Favorites
The model has a higher accuracy when predicting favorites to win than underdogs, but the underdog predictions can still turn a slight profit. However, making 6 units on 110 picks (60% ML CC on underdogs) is a relatively small return. As the confidence increases the sample size shrinks, so the numbers at 65% and 70% ML CC must be considered with caution.

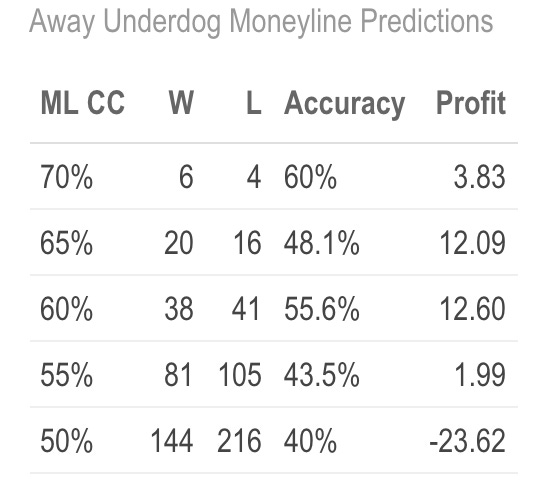
Away Underdogs vs Away Favorites

Home Underdogs vs Home Favorites


Thanks for reading and thanks for being a Dinger Stats subscriber. The daily sheet will always be free and we hope that you keep it in your sports betting toolbox.
You can support Dinger Stats by becoming a paid 110 Club subscriber. It is $10/month and includes picks for moneyline, first five innings, runline, and also has a money back guarantee: if the picks don’t turn a $100 bankroll into a $110 bankroll by the end of each month you’ll get your money back.
If you have suggestions, questions, comments please write to mail@dingerstats.com or find us on Twitter @DingerStats